
UZBEKISTAN: INTRO & MACRO
Uzbekistan Population: 37 million
GDP in 2024: $ 115 billion
GDP per capita 2024: $ 3854
Real GDP growth rate 2021−2025E, average: 6.1%
GDP in 2024: $ 115 billion
GDP per capita 2024: $ 3854
Real GDP growth rate 2021−2025E, average: 6.1%
GDP breakdown by sectors:
Services: 44.0%
Industry (Mining, Processing): 23.5%
Agriculture: 20.6%
Construction: 7.1%
Industry (Mining, Processing): 23.5%
Agriculture: 20.6%
Construction: 7.1%
Foreign reserves, as of May 2025, $ 49.25 bln
Gold in Foreign reserves: 76.4%
Base Rate (Central Bank of Uzbekistan): 14%
Inflation, CPI: 8.7%
Reserve rates: LC (UZS) 4%, FC (USD, EUR, CNY) 10.5%
Gold in Foreign reserves: 76.4%
Base Rate (Central Bank of Uzbekistan): 14%
Inflation, CPI: 8.7%
Reserve rates: LC (UZS) 4%, FC (USD, EUR, CNY) 10.5%
Gold accounts for 32% of total exports, and services over 20% of exports.
Total exports, 2024, US$: 31.9 billion
Total imports, 2024, US$: 55.5 billion
Total exports, 2024, US$: 31.9 billion
Total imports, 2024, US$: 55.5 billion
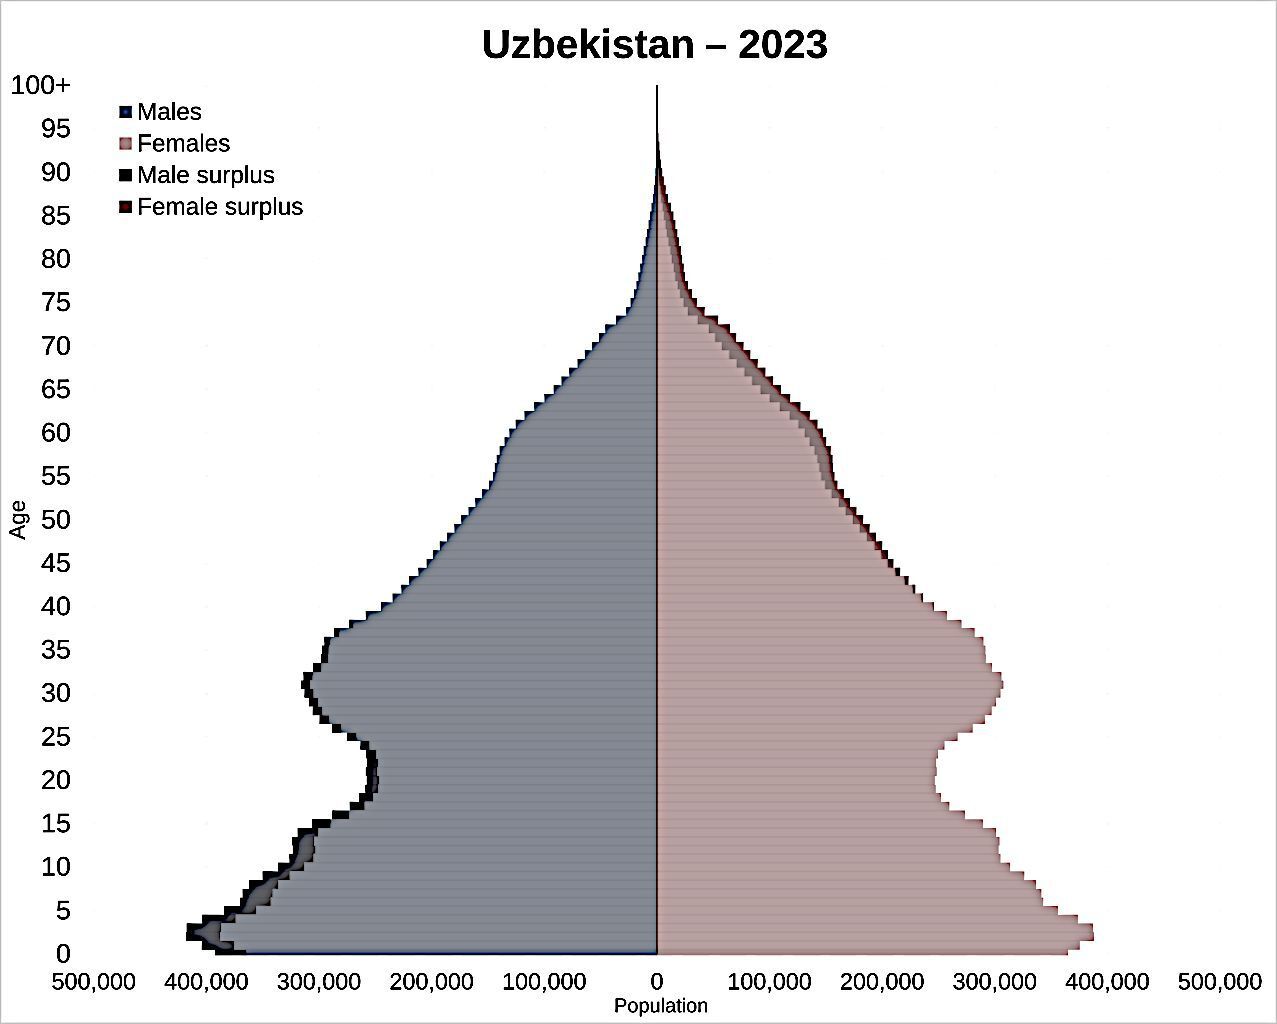
Healthy demographic structure, in contrast to many other parts of the world , solid basis for current and prospective economic growth
Data Sources: Central Bank of Uzbekistan, National Statistics Committee of Uzbekistan, World
Bank, Atlas of Economic Complexity — Harvard University
LOCAL BANKING SECTOR IS GROWING FAST, PRIMARILY DRIVEN BY FOREIGN CAPITAL
The FX regime liberalization of 2017, together with financial sector reforms, enabled the inflow of foreign capital into Uzbekistan.
Average total loans growth in the country during the past 5 years exceeds 20% p.a. (in local currency terms)
This tendency extends now to the level where loans are near 200% of deposit base, i.e., financed with foreign capital (banks, FIs) and state funds injections.
As a result, now total foreign debt is nearly 55% of GDP, while government debt to GDP is near 35%, and foreign liabilities are 3.8x times foreign assets.
65% of loans extended by commercial banks are in foreign currency, a legacy of the pre-2017 pegged & controlled FX regime.
NPL level at commercial banks decreased by 4.8% to 4.2% YoY (April 2025). 100bps decrease of NPLs at state-owned banks and 50bps increase at privately owned banks.
Though by our estimates, NPL levels in the banking system could
be significantly understated, especially at state-owned banks.
Our estimates for certain state-owned banks are based on levels of
NPLs EoY 2024 reported vs estimated:
Our estimate of real NPLs is mostly based on the calculated difference between accrued and cash interest income on loan portfolios, as well as on a study of loans and provisions dynamics
In recent years, lending to households was the main driver of total loans growth, growing 1.5−2-3x times of corporate lending growth rate.
Though total loans to households and individual entrepreneurs are 33% of the total loan portfolio of commercial banks in Uzbekistan
Though total loans to households and individual entrepreneurs are 33% of the total loan portfolio of commercial banks in Uzbekistan
TOTAL LOANS OUTPACING M2 DEPOSITS BY NEARLY 200%

Data Sources: Central Bank of Uzbekistan
UZS WAS AMONGST THE WORST PERFORMERS PRE-2017 BUT HAS STABILISED SINCE
Post-2017 selected FSU currencies performance

UZS (Uzbek Som) used to be among the worst-performing former soviet bloc currencies.
Since the FX regime change and liberalization in 2017, it has performed nearly at par with regional and FSU peers
Total USD appreciation vs UZS during the last 5 years (2021−2025) was 26.5%, or nearly 4.8% per year.
In the last 12 months, USD/UZS has been nearly flat.
While Uzbekistan Central Bank base rate during this period was in the range of as high as 17% and as low as 13.5%, and the difference with Fed Funds Rate was ranging from 13.9 percentage points in 2021 to 16.8 pps in early 2022 and declined to 9.7 pps as of May'2025
Data Source: Tradingview
LOCAL STOCK MARKET HAS PERFORMED VERY POORLY
Local stock market affected by single stock transactions

The local stock market is thin in terms of active names and liquidity. It is significantly affected by single-name trades, e.g., in Feb'2021, when the move in 1−2 single stock names (insurance and cement company) caused a 200%+ move in the index.
In addition to that, most of the trades were executed in a direct trades regime (Nego Board), i.e., similar to OTC trades but executed via a stock exchange.
In total local stock index (Uzbekistan Composite) grew by a mere 4% since 2019, excluding dividends.
Local investors and HNWI, therefore, park their money in high-yield fixed income.
Data Source: Central Bank of Uzbekistan, Tashkent Stock Exchange, Flag Ventures' own calculations
OVERVIEW OF UZBEK FIXED INCOME OPTIONS [1]
Main UZS fixed income broadly available for investors: local government bonds, local corporate bonds, bank deposits.
Local Ministry of Finance government bonds
On average, issued 500B of UZS debt per week in 2025 (approx. $ 38 mln). With YTM depending on maturities mostly in the range of 14.15% to 15.25% (see chart)
Secondary market activity is near 20% of primary market (mostly buy and hold investors).
UZS bank deposits
Currently average banks' UZS deposit interest rates for 12+ months deposits range is 18−22%
Deposits are insured for all private individuals (including non-residents) for 200 mln UZS, approx. $ 15,500 equivalent
Current Government issues UZS Yield curve
Short-end, up to 3−4 years, is more relevant as in many other EMs, with longer term maturities being mostly theoretical, model values

Data Source: Central Bank of Uzbekistan, Uzbekistan Exchange
OVERVIEW OF UZBEK FIXED INCOME OPTIONS [2]
Local UZS Corporate bonds
Currently, 33 corporate bonds are available at the Tashkent Stock Exchange, most of the volumes, though, are being traded either directly via brokers, HTM investments, or traded on the exchange via direct trades (Nego Board), i.e., OTC trades settled via the exchange.
Typical size of issue is in a range of 5 to 50 bln UZS, with a median around UZS 25 bln, which is equivalent to $ 0.4 mln to $ 3.9 mln and a median of $ 2.0 mln per issue.
Since 2022 till the end of 2028, interest income on corporate bonds was exempted from income tax both for individuals and legal entities, including non-residents.
Coupons of the current issues are ranging from 18% to 29%, with recent issues of late 2024 and early 2025 mostly in the 25−29% range.
Average maturity at issuance is three years for corporate bonds.
Typical coupon frequency for corporate bonds — monthly.
Investor profile: HNWI and affluent local investors, HNWI non-resident investors, foreign institutional local currency investors for HTM portfolios.
The total amount of corporate bonds traded on the Tashkent Stock Exchange in Q1 2025 amounted to $ 13.7 mln equivalent (UZS 213 bln), 51x times growth compared to Q1 2024. Volume of non-listed instruments traded in Q1 — $ 108 mln equivalent (UZS 1.4 trln)
Data Source: Uzbekistan Exchange
WHY WE FAVOR CORPORATE MICROFINANCE COMPANIES
BONDS over other local currency fixed income instruments
- Better yield/quality/credit spread compared to commercial banks;
- Higher coupon frequency allows for to decrease in credit and FX risk via collecting and converting coupons;
- Low exposure of issuers to FX risk, more transparent business model, and no subsidized loans.
ISSUER OVERVIEW: COMPANY 1 AT 27% YTM
Sector: Microfinance Company, started in 2017, operates 22 branches (outlets) in 7 regions in Uzbekistan, serving 10,000 clients.
Current outstanding bond issues:
Issues from1 to 2 years maturity at 27% YTM
Trades are mostly executed at par, i.e. no fluctuations from YTM, coupon at issuance.
Quotes on exchange gross with accrued interest.
FINANCIALS
Data for Q1 2025
- Total loans extended (net of provisions) — UZS 141.77 bln, approx. $ 11 mln equivalent
- All loans are in local currency
- Loans are 100% collateralized, of which 55% with gold and other precious metals, 32% with cars, 11% with real estate
- Loans up to 12m — 58% of portfolio, remaining 1−2 year loans
- Gross NLPs reported — UZS 1.1 bln, i.e., 0.78% of the portfolio
- Own equity — UZS 53.58 bln
- Own Equity to total assets — 34.7%
- Net Profit Q1 2025 — UZS 11.0 bln
- ROE 1Q 2025 annualized — 103.5%
The company demonstrates consistent results, no significant unusual or non-recurring items
Data Source: Company reports, Uzbekistan Exchange, Central Bank of Uzbekistan
ISSUER OVERVIEW: COMPANY 2 AT 29% YTM
Sector: Microfinance Company, started in 2018, operates 30 branches (outlets) in 8 regions in Uzbekistan.
Current outstanding bond issues:
Issues up to 1 year maturity at 29% YTM
Trades are mostly executed at par, i.e. no fluctuations from YTM, coupon at issuance.
Quotes on exchange gross with accrued interest.
FINANCIALS
Data for Q1 2025
- Total loans extended (net of provisions) — UZS 96.0 bln, approx. $ 7.5 mln equivalent
- Loans are 60% collateralized, 45% of gross loans are secured with cars, and 8.5% with real estate. Improved from Q1 2024, when 62.5% were ‘blank' loans
- Loans up to 12m — 63.5% of portfolio
- By our estimate NPL level in Q1 2025 is near 9% compared to the estimated 14.5% in Q1 2024. Reported level of NPLs stands at 3.7% for Q1'25 and 6.2% for Q1'24
- Own equity — UZS 88.0 bln
- Own Equity to total assets — 60.0%
- Net Profit Q1 2025 — UZS 5.0 bln
- ROE 1Q 2025 annualized — 24%
If we adjust for one-off revenue items and provisions released in
Q1'25, then Q1'25 would have returned a UZS 0.2 billion loss instead
of 6.0 billion in profit before tax
Data Source: Company reports, Uzbekistan Exchange, Central Bank of Uzbekistan
UZS DEPRECIATED AGAINST USD BY ~4.8% p.a. 2021
Illustration of return scenarios
To illustrate return sensitivity depending on various UZS depreciation scenarios expressed as a rise in USDUZS exchange rate.
For illustration purposes and to eliminate other factors, we have assumed that the USD reinvestment rate for the whole (1, 2, 3 years) period at 0%. UZS coupon assumed at 27%
Illustration of return scenarios: Comment
Calculations show that even at extremely high 15−20% USD appreciation vs UZS per annum during three years, the investor may expect a positive USD return, assuming coupon conversion into USD
We have also assumed that the investor converts UZS coupon into USD each month, thus limiting his/her exposure to UZS as well as to the issuer’s credit risk. We also assume for the purpose of this illustration that devaluation is evenly spread during the calendar year.
Note that 20% USD appreciation means 42% loss of USD value of capital during three years, but even that is compensated and results in positive returns with a coupon as high as 27% in UZS.
Results are presented as cumulative return for respective period (1, 2, 3 years) to illustrate the effect of devaluation withthe mentioned inputs.
UZBEKISTAN: KEY RISKS & RISK MITIGATION FACTORS
KEY RISKS AND FACTORS TO WATCH (most to less likely)
- UZS depreciation due to external, internal factors; Reversal of the FX liberalization regime
- Economy slowing down, real wages decline, significant growth in NPLs;
- Competition may push lenders into riskier loan underwriting, harming their profitability, and bearing potential
- growing loan losses;
- Institutional deterioration, if it happens, may potentially result in lower law enforcement, leading to uncontrolled and unchecked defaults.
MITIGATING FACTORS
- Investors can convert the monthly coupon into USD; Borrowers and Lenders (issuers) are not directly exposed to FX risks when borrowing in local currency.
- People are already borrowing at 30−40%+ interest rates and managing. Loan portfolios have a high turnover and fast repayment. Can select issuers where their loans are 100% collateralized.
- Limited holding period (1−2-3 years) limits this risk; also monitoring overall and individual financials; lending companies have a high equity cushion, i.e,. able to absorb losses;
- At the moment, we see this as a very low probability risk, as it will be a complete reversal of the current policy and trajectory
Flag Ventures helps you remotely access undervalued real estate and fixed income investments globally. We focus on lesser known opportunities, especially those in emerging markets.